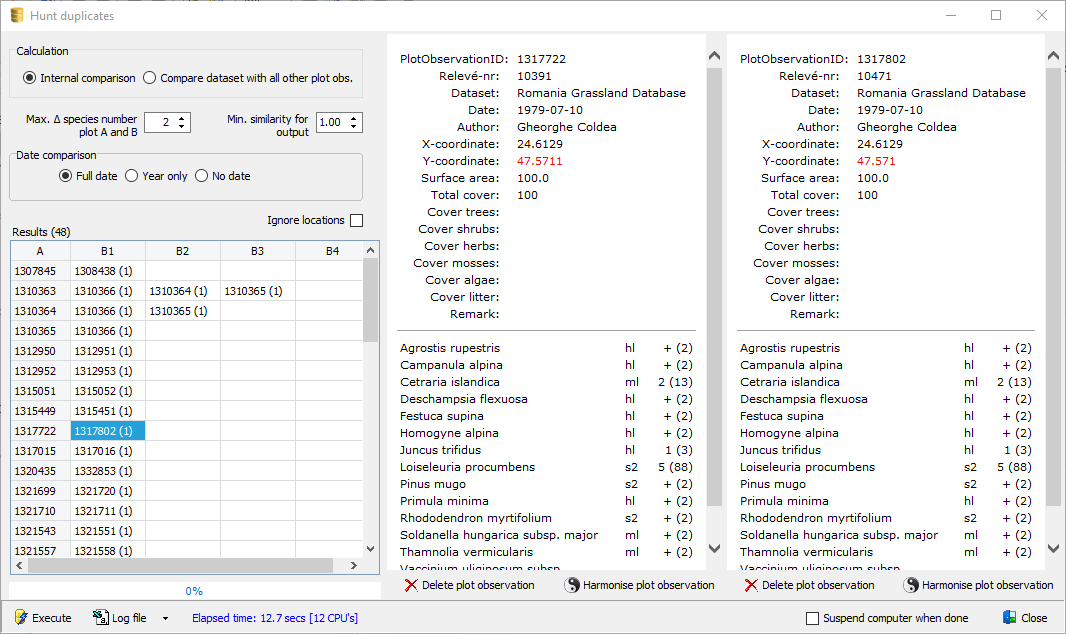
The Find duplicates option enables to locate duplicated plots within a single dataset, within a number of selected datasets, or within the whole database, provided that all datasets are linked to the same taxonomy (Internal comparison). It is also possible to compare the plots belonging to a dataset with all other plots in the database (Compare dataset with all other plot obs.). The latter is useful if a new dataset potentially can add duplicates to the database.
The plots can be completely identical or there might be a difference in number of species or cover abundance code. Duplicates can be detected by calculating the floristic similarity between two relevés using the formula: i = c/(A + B - c) (= Jacquard-index), where c is the number of species shared, A the number of species unique to one relevé and B the total number of species of the other relevé. If i = 0 there is no floristic similarity between the relevés, if i = 1 the relevés are fully identical. This formula is extended in such a way that the cover abundance of the species is also taken into account: Srij = ∑kykiykj/(∑kyki2+ ∑kykj2 - ∑kykiykj) (Ball's similarity ratio).
To speed up the process the similarity between two plots is only calculated if the year or full date and location (XY) are the same. The calculation is also performed if the date or the location is missing in either of the two plots, or in both plots.
For each plot A a maximum of the 4 most similar plots are stored (columns B1, B2, B3, B4 in the results table).
After the analysis is completed, and potential duplicates have been detected, a manual side by side comparison of two plots can be performed by navigating through the list of results. Differences in the plot header data and species composition are marked with red colour, enabling a quick and reliable assessment. To delete either of the two plots a button for each of the two plots is located at the bottom.
Max. ∆ species number plot A and B: Plot couplets with more than a given difference in number of species counts are not evaluated.
Min. similarity for output: Information is only logged if the similarity between two plots is higher of equal to the given value.
Date comparison: Select either of the two options if the analysis should be performed on the full date or for a less strict comparison only on year.
Execute: Execute the analysis.
The results can be stored in and retrieved from a log file.