Datasets can be opened by double clicking the name of the dataset in the index, or by pressing the Enter- or Return-key.
The dataset from consists of four tab sheets, Plot observations, Location, Metadata and Photographs.
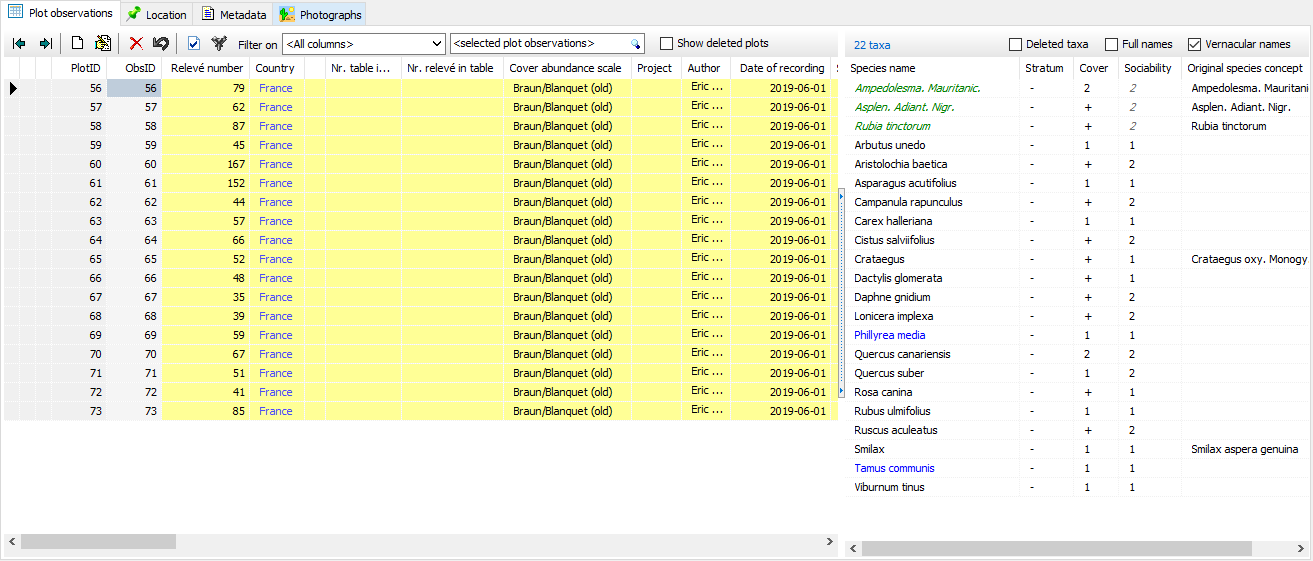
Plot observations
On the left site header data of a number of plots, on the right side a list of species that are related to the header dat row with ObsID 56.
The different colours have the following meaning:
oHeader data.
▪Blue colour: a value that has been updated. Ctrl + Left mouse button shows the history of the selected cell.
oSpecies data
▪Brown colour: when imported from a vegetation table (e.g. Excel table) the species was not matched. The species name is in such case will only be stored as 'original species concept'.
▪Blue colour: de species name is classified as synonym. See also Convert synonyms to accepted taxon names.
The button gives direct access to functions for navigation, enter a new, or modify an existing plot observation, delete and undelete plots and to set filters.
The check boxes have the following functions:
oHeader data.
▪Show deleted plots: Deleted plots can be hidden or shown. Note that deleted plots are always excluded from selection and thus also from exports.
oSpecies data
▪Delete taxa: Deleted taxon names can be hidden or shown. Note that deleted taxa are always excluded from selection and thus also from exports.
▪Full names: Names can be shown with (full) or without authority, provided that the authority info is available.
▪Vernacular names: when this option is checked scientific names are extended with vernacular names, provided that vernacular names are present in the taxon list.
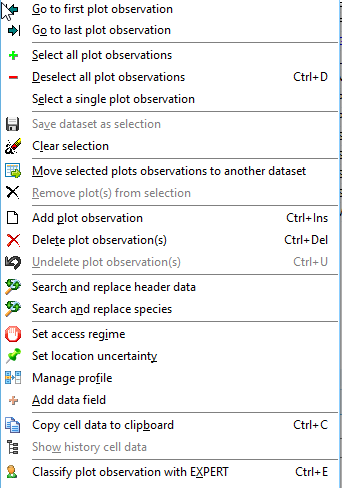
Context menu
|
Right clicking the header data table will pop-up a context menu which contains a number of short cuts to useful functions. Most functions are also available in the menu on top of the application.
•Copy content of a cell to clipboard •Show history cell data •Classify plot observation with EXPERT. |
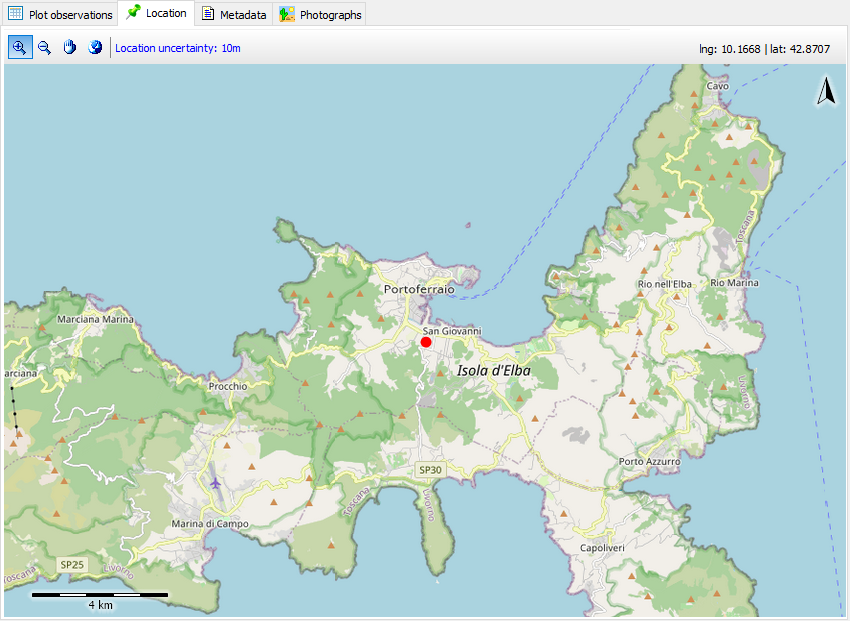
Location
The seconds tab shows the location of the current selected plot on the OpenStreetMap. To show the locations of multiple plots first select the records concerned and then select 'Distribution map' in the Export menu.
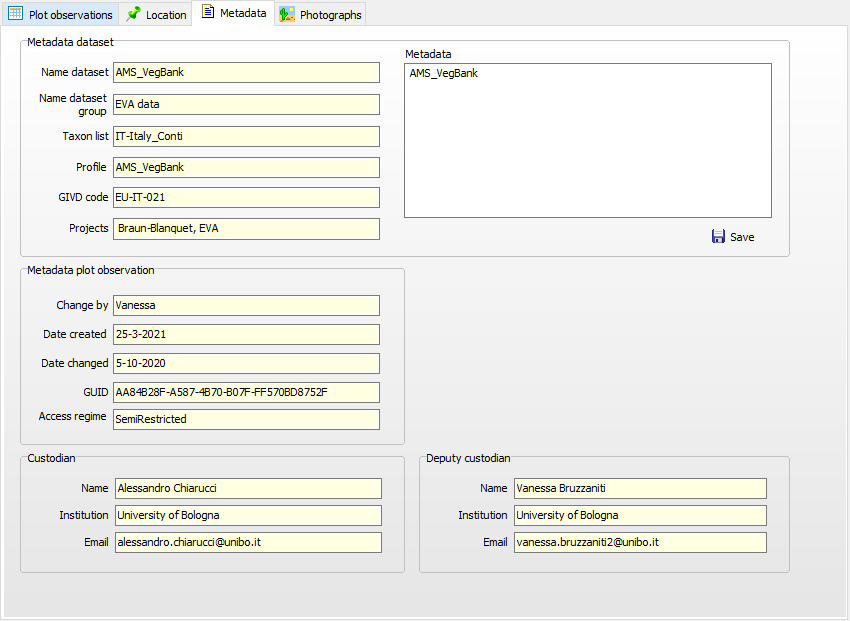
Metadata
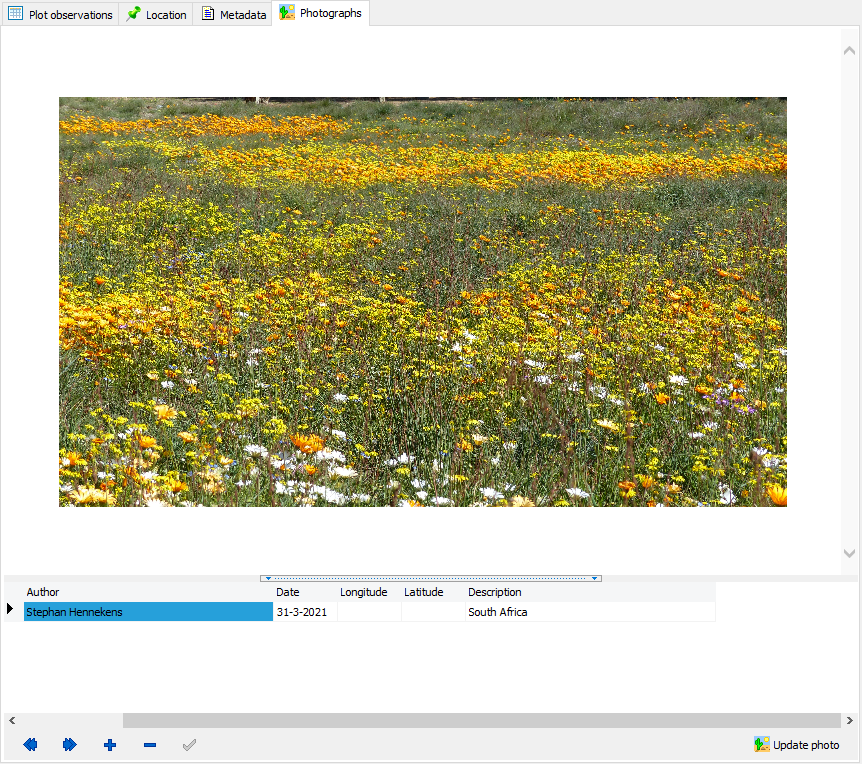
Photographs
To each plot observation multiple photographs can be connected. Photographs can be stored locally on a hard disk or in the cloud. Cloud storage is preferred as photos will be available for anyone who has access the Turboveg3 database.
To add a photo click the + button. An empty records is added to table that needs to be filled in. First enter the full path (or url) of the photo. Information on when (date) and where (longitude and latitude) are extracted from the photo, provided that this information is stored in the metadata section of the photo.
To remove a photo click the - button.
Document
In case a pdf document is connected to the dataset the file will be shown in a separate sheet Document.