With this option, ecological indicator values will be calculated for each plot observation in a dataset. However, this is only possible if the Turboveg2 species list (as taxonomic backbone for the Turboveg3 dataset) also came with the species traits database (Ecodbase.dbf) during import of a Turboveg2 database.
Note the the analysis is only possible on selected plot observations.
An ecological indicator value of a plot observation is the average of the indicator value of each species in a plot observation. Each species is only taken once into account, even if it occurs in multiple strata. Besides the average (field names start with 'AVG') there is also an option to calculate the standard deviation (field names start with 'STD') and the number of observations used for the calculation (field names start with 'N'). Cover abundance is not taken into account.
Min # of indicative species: Only plot observations with a minimum number of species with an indicator value are taken into account.
# decimals: The number of decimals used to round the calculated indicator values.
In case the procedure is applied to a single dataset, the fields that hold the calculated indicator values will be automatically added to the profile. By default, the new information will be displayed at the right end of the header data table. Via the Profile management the properties of the new fields can be changed.
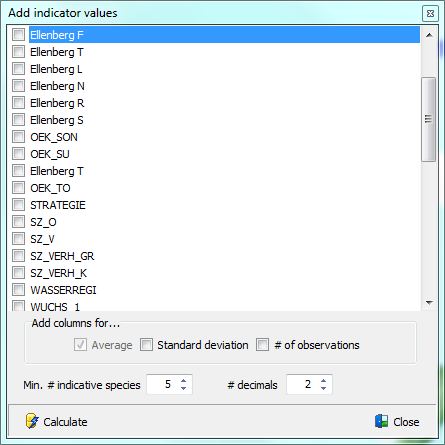
Databases other than Dutch databases include indicator values that are stored in the Turboveg2 Ecodbase database
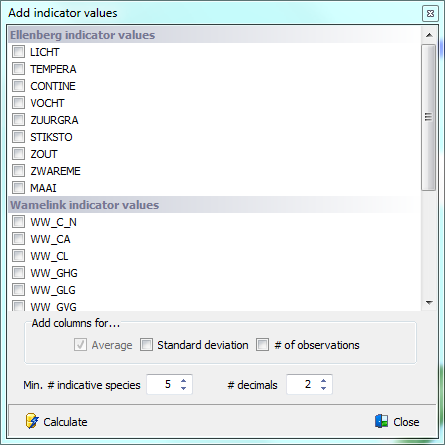
Dutch databases include Ellenberg and Wamelink indicator values