|
<< Click to Display Table of Contents >> Combine subplots into plots |
  
|
|
<< Click to Display Table of Contents >> Combine subplots into plots |
|
Menu: Edit | Combine subplots into plots
Use this option to combine subplots (or nested plots) in a single plot (relevé). Concerning the species cover two methods can be applied. One is a simply summarization of values (only used when the subplots have been recorded with the so-called Sigg-scale). The other one is the calculation of a mean cover value for each species. It is assumed that each subplot has the same surface area, thus the mean value is simply the summarization of the cover values of a species in the subplots in which it occurs divided by the total number of subplots belonging to a certain plot.
You must indicate which fields holds the identifiers for the plot number and subplot number. Turboveg will only combine those subplots which have non-empty values for plot no. and subplot no (in case of a numerical field the value must be greater zero).
The cover of the species in the resulting plot will always be in percentages, regardless the cover scale method used in subplots.
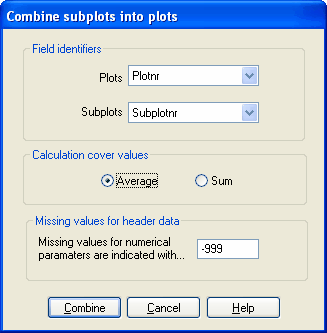
Concerning the header data Turboveg will only calculate mean values for fields that are defined as numerical (e.g. 'Total cover'). In case a certain value is equal to the defined missing value the value is ignored. For fields that are defined as character (e.g. 'Author') the value of the first subplot is copied into to combined plot.