A selection of plot observations can be summarised into a synoptic table. For each species the frequency of occurrence and the Mean If Present (mip) value are calculated.
The mip value is the mean cover abundance of the species taken from the plots in which it occurs.
The order of the species or frequency be changed by sorting (click the header) or by dragging a row to another position. Columns can also be dragged to another position
The table can be saved to an Excel file.
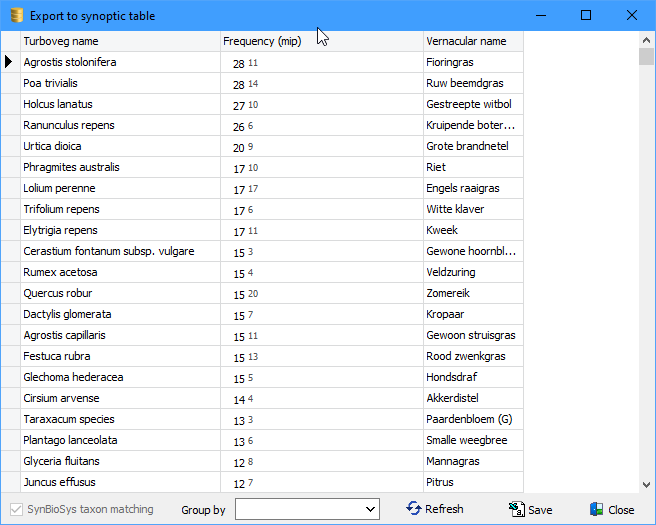
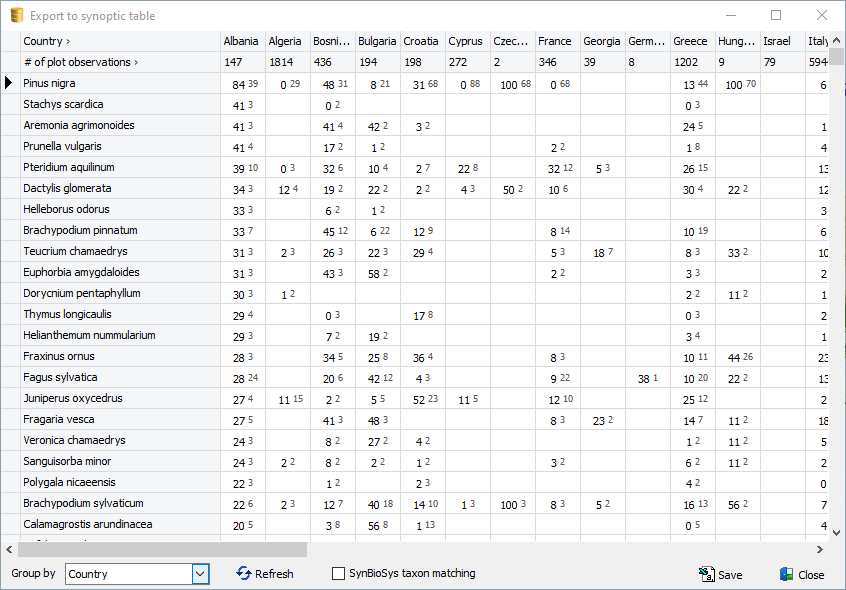
A selection of plot observations can presented as an overall synopsis (screen short above) or grouped by means of a header data item (screen short below). Make sure the option SynBioSys taxon matching is unchecked
After having selected an item for grouping press the Refresh button.