SynBioSys Fynbos
An information system on sustainable management of biodiversity in the Cape Floristic Region
| home |
| application |
| download |
| participate |
| partners |
| contact |
| The application |
|
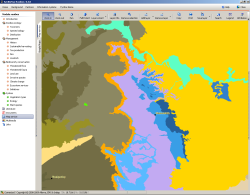
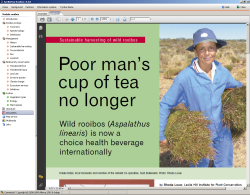
Access & explore: SynBioSys Fynbos offers access to a wide range of documents. Spatial analysis is supported by an integrated GIS with several pre-defined data layers - allowing the user to create maps and integrate own layers, own data points and to create own customized maps. The standalone GIS platform is easy to use and suitable for capacity development of practitioners, researchers and professionals working in the Fynbos Biome. The spatial data also includes Google Earth, and can thus show satellite imagery with own and pre-defined data. Analyse & manage: The integration of data bases and applications such as Google Earth, combined with access to the ALUKA specimens creates unprecedented opportunities for thorough and innovative analysis of a wide range of issues. The application allows the user to create own maps and to export and print synergic data sets and results of analysis. The results can be practically used by land managers and conservation agencies. Rooibos module: Within the rooibos module, various information with regard to (Wild) rooibos and its position within fynbos is opened up. This includes for example distribution maps, literature and movies. Baviaanskloof module: This module covers a wide range of biodiversity and socio-economical aspects of the Baviaanskloof Mega Reserve. It also includes maps, documents and movies specific for the area. Getting started: If you want to get an idea how SynBioSys Fynbos works then we suggest to read the 'Quick start guide' first. For analyzing data some test data with documentation of how-to is available in the 'Test data' folder after installation. |
| GIS and other data | ||
|
||