Whether a new plot observation or an existing one needs to edited is the same. On the left side of the form administrative (header) data can be added of edited. On the left side the species data entries can be added or edited.
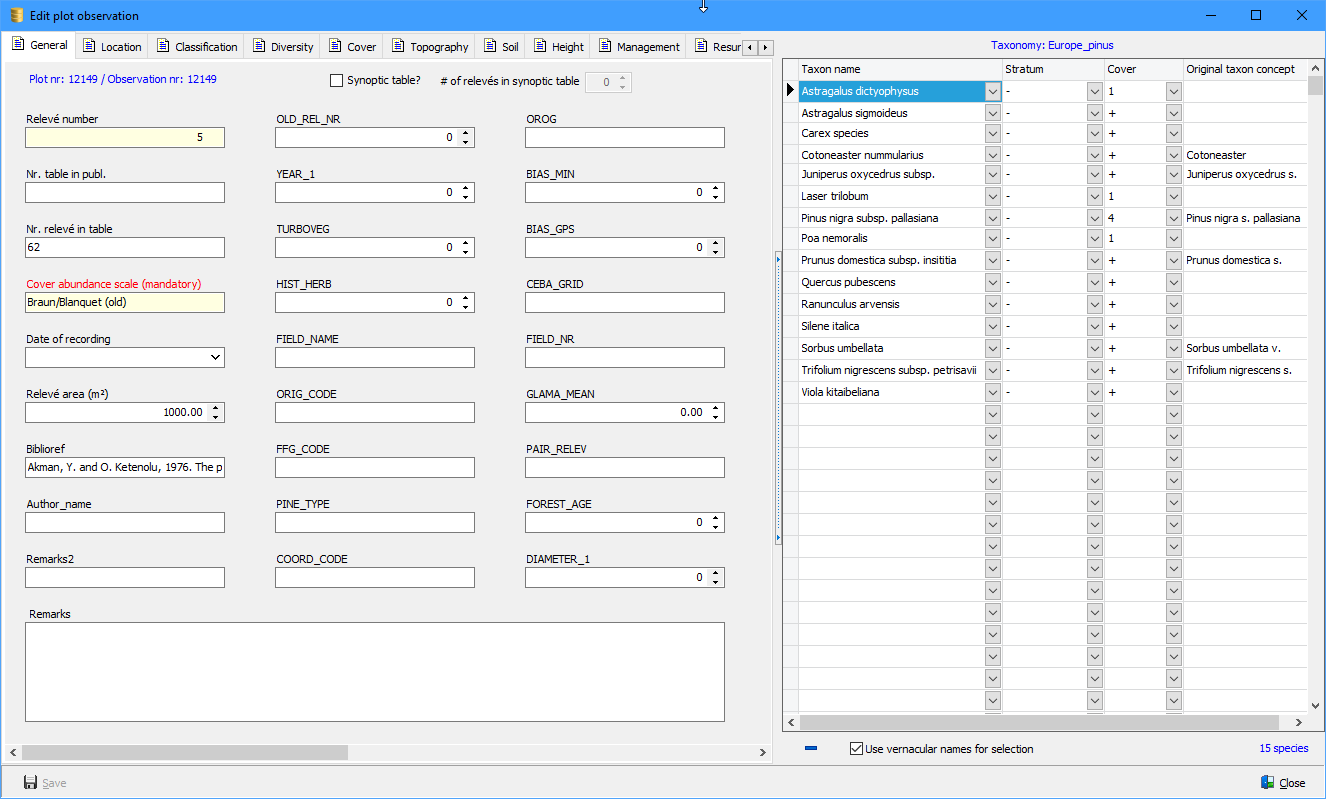
Header data entry
The tabs on the left side of the window are determined by the data field groups to which data fields are assigned to. For defining data field groups go to Manage, Data field groups. When groups are defined data fields can be assigned to these groups (Manage, Data fields).
Data field groups are useful if the administrative data needs be presented in an uncluttered way. Which data fields are overall shown and in which order to be presented in the forms is determined by the profile to which the dataset is connected. For changing a profile go to Manage, Profiles.
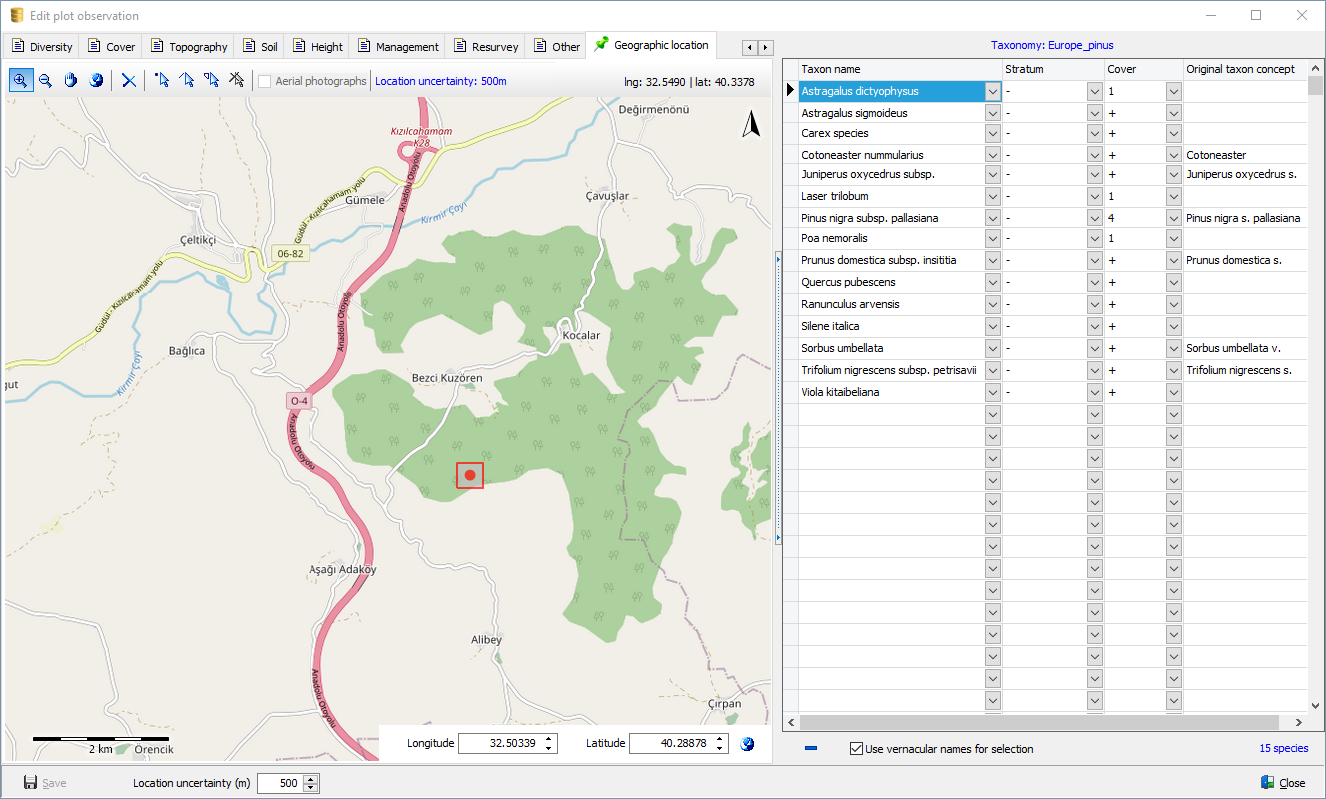
Check the option Use vernacular names for selection in case you are not familiar with scientific taxon names. However, this is only possible if vernacular names are present in the taxon list.
Species data entry
Species data can only be entered after the cover abundance scale has been selected. For selecting a species name from the taxon list start typing in a cell in the first column. Only after having entered 7 characters (including a space between genus and epitheton) a list of suggestions appears. If the list does not appear automatically click the arrow on the right side of the cell. Hints on how to select a species name can be found here. For Stratum and Cover fixed lists are available to select from.
Geographic information (the location of a plot) needs to be specified on the last page of the form with administrative data. Do not enter coordinates on one of the other tabs, otherwise the geographic information will not be stored properly in the database.
Coordinates can be specified at the bottom of the form or by selecting one of the buttons at the top of the map and put a marker, draw a line or a polygon to pin point the plot.
At the bottom of the window the location uncertainty can be specified. For GPS coordinates 3 to 5 meter is a plausible value.